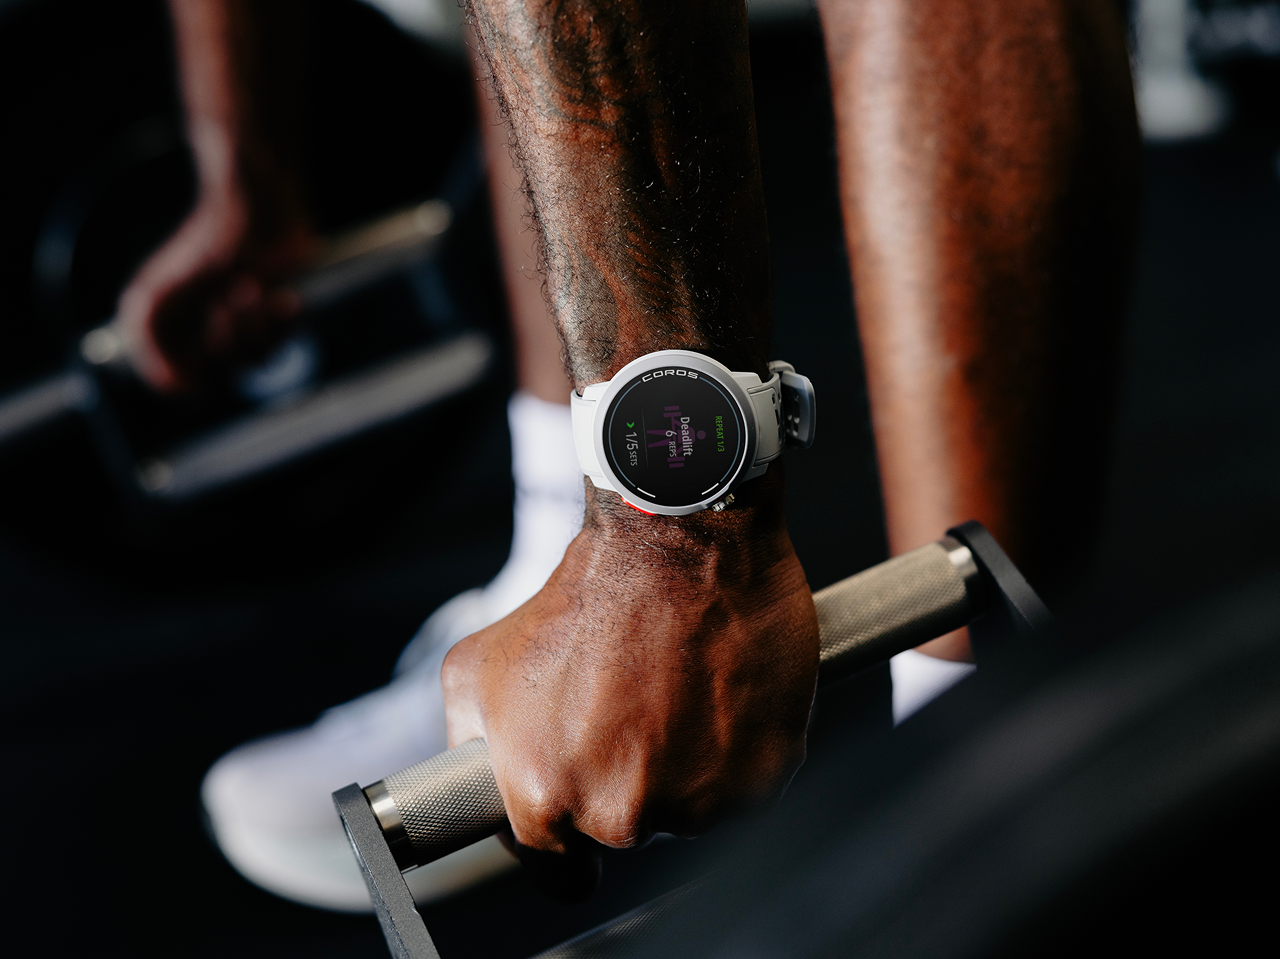
Proper training volume is critical for making the most out of your race preparation. "Am I training enough?" and "Am I training too much?" are questions that athletes are constantly asking themselves. COROS provides a metric called Training Status to answer these questions, and give athletes confidence that they are on the right track.
What Is Training Status?
Training Status is a way to help you understand the impact that recent training has on your body. Your status consists of 3 different metrics, each relating to the Training Load of your workouts. Let’s define each metric:
- Base Fitness: This metric is a 42-day rolling average of your daily training load. Think of this as your long-term metric. It measures your ability to take on hard sessions with higher training loads.
- Load Impact: This is a 7-day rolling average of your daily training load. Think of this as your short-term metric. It measures the amount of impact brought to your body from recent training load.
- Intensity Trend: This is the relation between short- and long-term workload. In short, Intensity Trend = Load Impact ÷ Base Fitness.
Coaches Tip: If you look closely at the Intensity Trend value, you will notice that this very simple formula stands out: Intensity Trend = Load Impact ÷ Base Fitness. A number above 100% means that your short-term load is higher than your long-term training, and vice-versa.
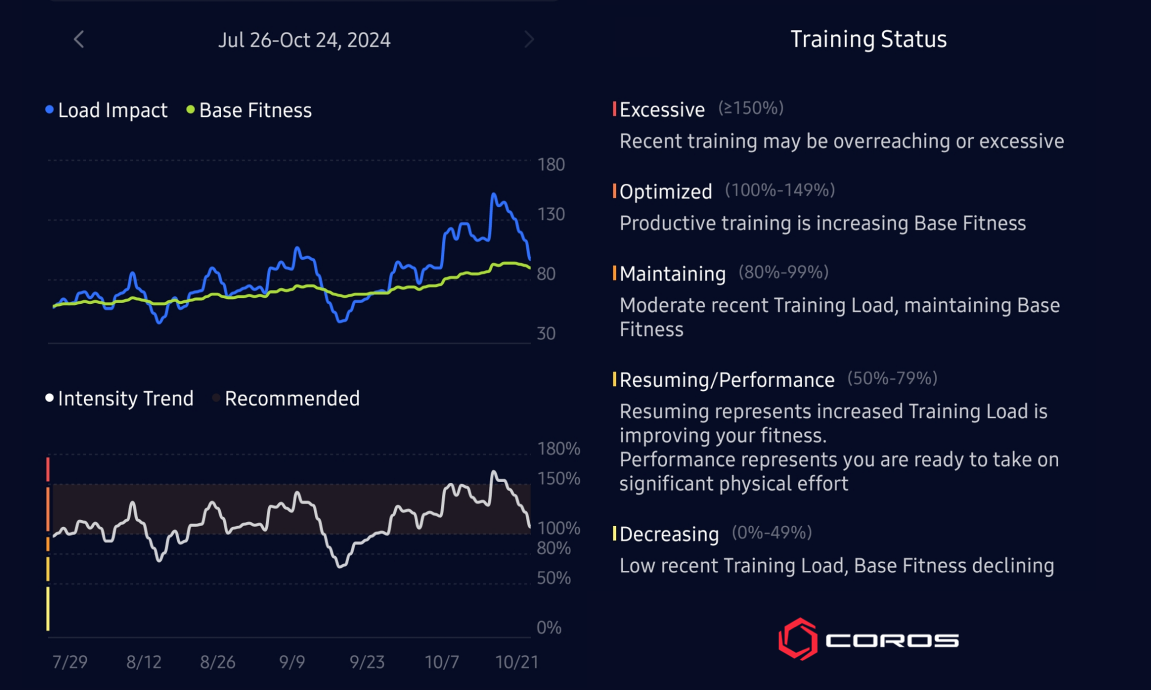
Training Status as seen from the COROS app.
How To Interpret Your Training Status
While Intensity Trend is a great metric, numbers aren't always the easiest to read. Training Status turns that number into words to give you an overview of where your current training stands. Let’s take a look at each term you may encounter throughout your training.
- Excessive ( > 150%): Recent training may be overreaching or excessive. A reduction in training load is recommended to avoid injury.
- Optimized (100-149%): Base Fitness gradually increasing.
- Maintaining (80-99%): Moderate recent Training Load, maintaining Base Fitness.
- Resuming (50-79%): Recent training is gradually increasing your adaptation to higher training load.
- Performance (50-79%): A reduced load has your body ready for high-performance efforts.
- Decreasing (0-49%): Base Fitness rapidly declining.
COROS Education: You may notice that "Resuming" and "Performance" both have an intensity trend range of 50-79%. If your previous status was "Maintaining" and your load has decreased, it will show "Performance". If your previous status was "Decreasing" and your load has increased, it will show "Resuming".
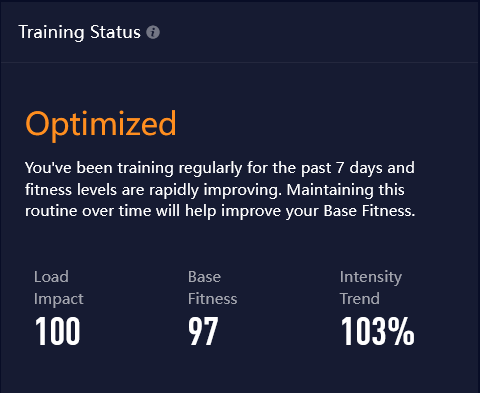
Quick Overview of Training Status from EvoLab.
Understanding the Training Status Graph
Let’s take a look at the Training Status graph from EvoLab. This chart can provide some of the best insights in the entire COROS platform. Here, we'll be showing you how to read this graph. On each example, there are 3 lines. The blue line is Load Impact. The green line is Base Fitness. Lastly, the orange line is Intensity Trend.
Below are examples of how the graph looks when you are increasing, maintaining, and decreasing your Base Fitness. All three phases have their place in training, so athletes will find themselves in all three scenarios at some point during their training journey.
Coaches Tip: One key thing to look for is if Load Impact is above or below Base Fitness. Above indicates growth, while below indicates recovery.
Chart Example - Gaining Fitness
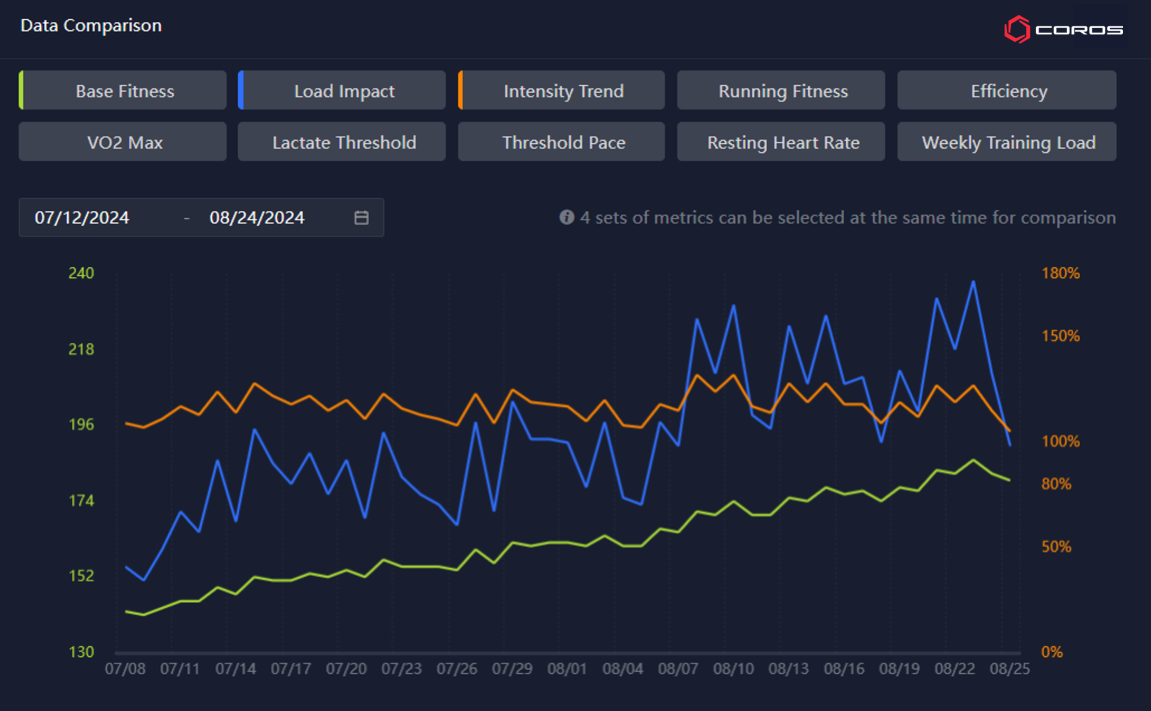
In this example, Load Impact is higher than Base Fitness, leading to an Intensity Trend above 100% (within the recommended range). The training outcome is an increase in Base Fitness over time. This is what a graph should look like during a training block leading up to a race.
Chart Example - Maintaining Fitness
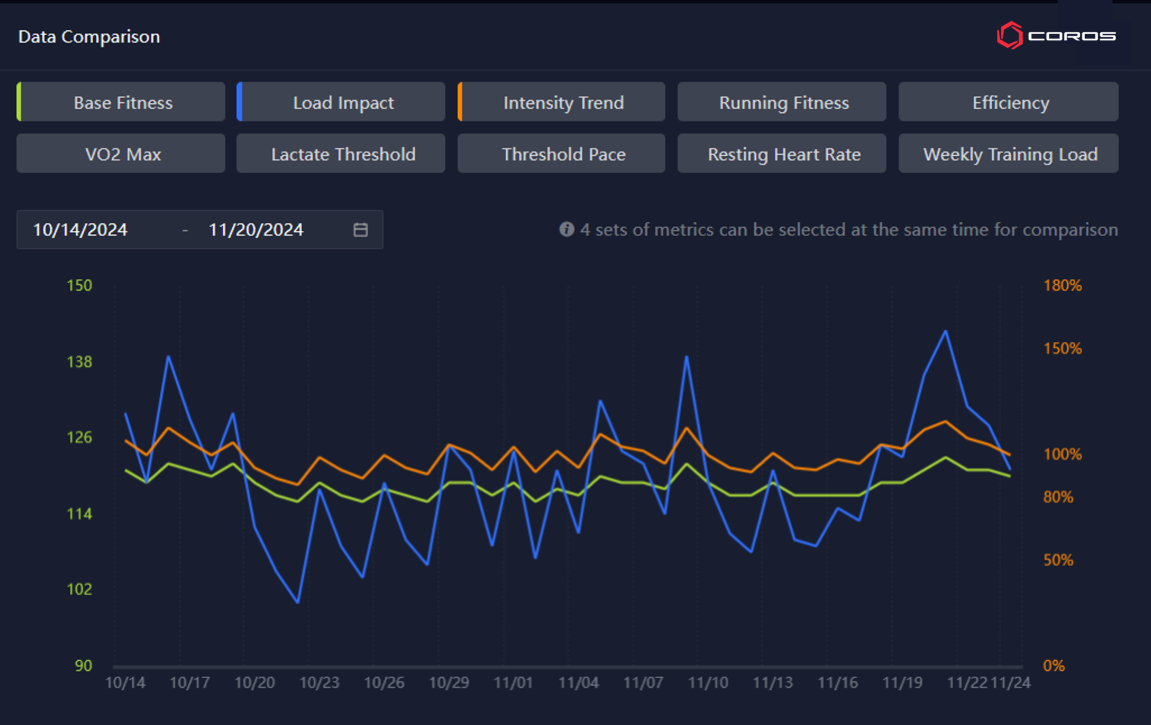
In this example, Load Impact and Base Fitness are very close, often overlapping. This leads to the Intensity Trend value staying close to 100%. The training outcome results in maintaining Base Fitness. Maintenance is often utilized during the offseason or if you have a short period between two races.
Chart Example - Decreasing Fitness
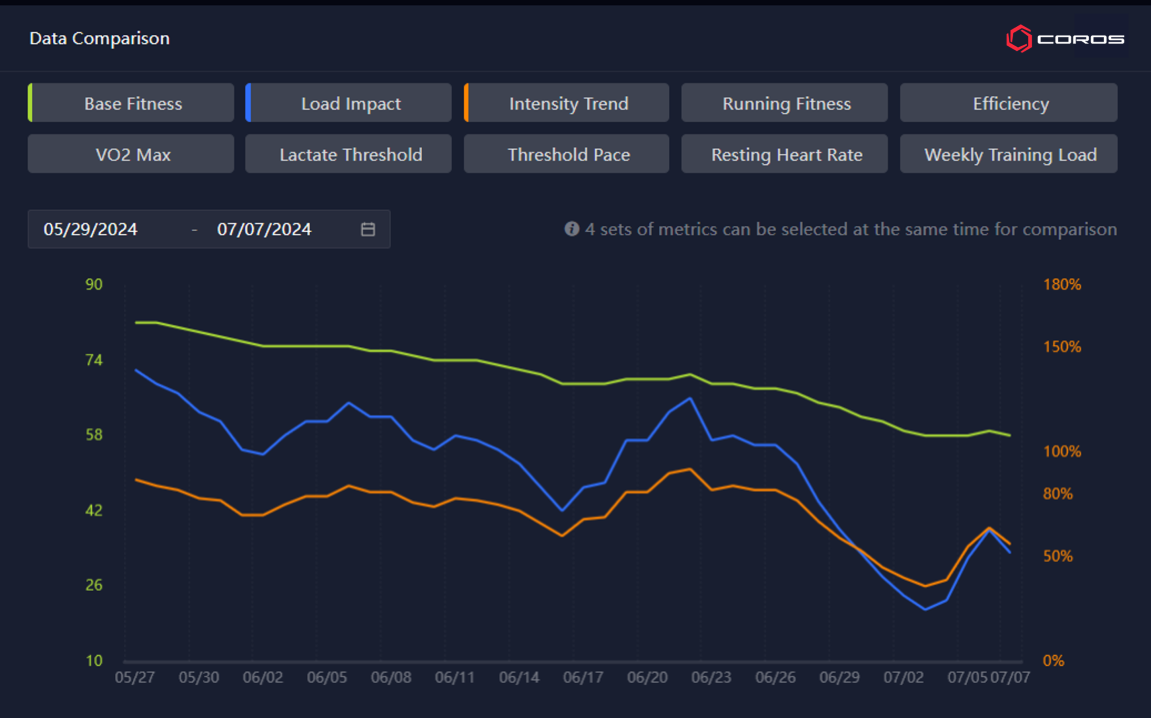
In this example, Load Impact is lower than Base Fitness, leading to an Intensity Trend below 100%. The training outcome is a decrease in Base Fitness. While a decreasing value may seem like a bad thing, this is not always the case. It actually indicates recovery and reduced fatigue. This is commonly seen during a taper period before a race, following a race, or during an athlete's offseason.

/filters:quality(90)/fit-in/970x750/coros-web-faq/upload/images/b7991b389f1030b0a45d4eee2c88c552.png)


