/filters:quality(90)/fit-in/970x750/coros-web-faq/upload/images/624383cd621e23d4e0845f6c6c05a348.png)
While many runners focus on the intensity and distance of their runs, recovery often gets overlooked. However, paying attention to recovery metrics gives you valuable insights into how your body responds to the demands of training. Understanding these metrics and how they interact with each other not only will help to improve your performance but also lower your risk of injuries.
Read more below about how to incorporate the different COROS recovery metrics to get the most out of your training.
Weekly Training Load
Training Load (TL) refers to a value displayed for each activity to tell you how difficult it was. The higher the TL is, the more difficult the activity was for your system. Weekly Training Load summarizes all your TL scores from the week and provides a trend that can be quickly seen in your COROS app, or be monitored more closely on your COROS Training Hub.
Training Load is calculated based on the following variables:
- Duration (minutes)
- Intensity (HR)
The shaded area in the graph's background refers to a suggested TL range. EvoLab keeps learning about your training habits and will suggest a Weekly TL range for the upcoming week.
- Top of Range: Safely building fitness
- Bottom of Range: Maintaining fitness
- Above Range: Overreaching or overtraining
- Below Range: Losing fitness
Why does this metric matter? Training Load only takes into account the volume and intensity of your workouts without looking at any other fitness metrics. It is then ideal to monitor to get a clear picture of your workload distribution over time.
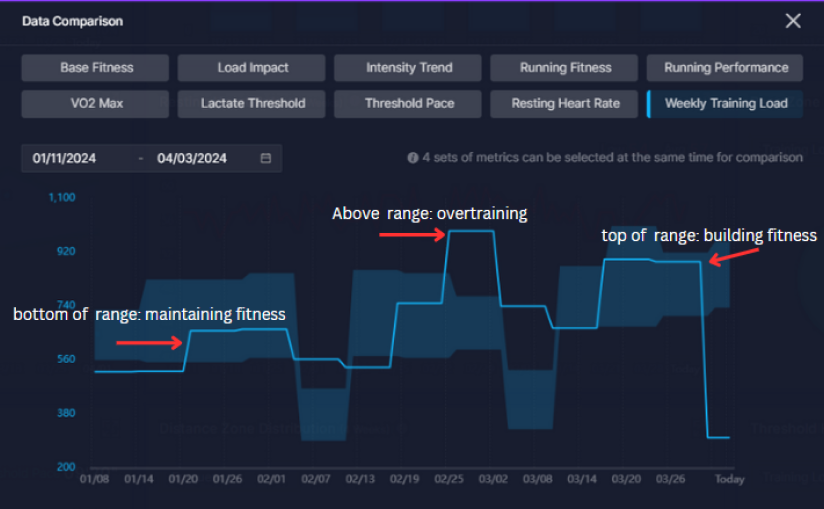
Weekly Training Load as seen from COROS Training Hub.
Intensity Trend
Intensity Trend is part of your Training Status and takes into account your recent and overall training to show how your body is responding and recovering (or potentially not recovering). It is based on:
- Training Load (sessional load)
- Base Fitness (long-term load)
- Load Impact (short-term load)
Intensity Trend can be categorized into one of six statuses to help you avoid overtraining and lower the risk of injury.
- Excessive: Recent training may be overreaching or excessive
- Optimized: Base Fitness gradually increasing
- Maintaining: Moderate recent Training Load, maintaining Base Fitness
- Resuming: Recent training is gradually increasing your adaptation to higher training load
- Performance: Ready for high-performance efforts
- Decreasing: Base Fitness rapidly declining
Why does this metric matter? Intensity Trend reflects your fatigue based on your current fitness level over the past week. This metric is ideal to target specific ranges of fatigue to make your training as efficient as possible.
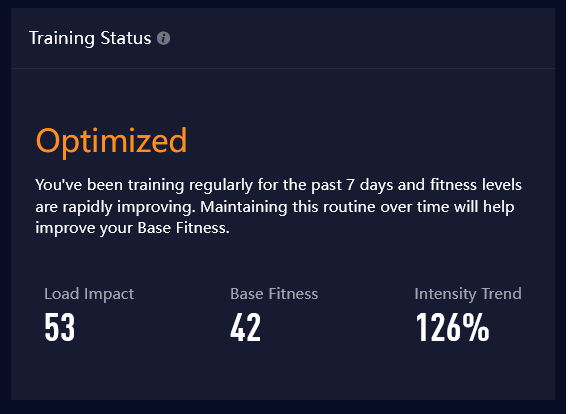
Overview of Training Status from EvoLab.
Recovery
Recovery Timer provides feedback after each training session on the time needed for full recovery and suggests when you are ready for easy or hard training. It is based on:
- Base Fitness
- Training Load
- Remaining energy since your last workout
Typically, you do not need to be fully recovered before you start the next training session. It's important to remember that the ideal recovery time will vary from person to person. Listen to your body and make sure to include at least one full rest day each week.
- 0%-19%: Exhausted
- 20%-69%: Fatigued
- 70%-89%: Normal
- 90%-100%: Fresh
Why does this metric matter? The Recovery metric is very similar to your Intensity Trend, but it is displayed as a time to help you guide your training on a practical level.
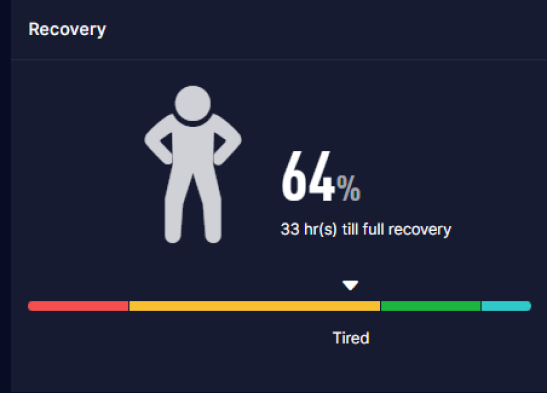
Overview of Recovery from COROS Training Hub.
Overnight HRV
HRV, compared to other COROS recovery metrics, focuses on your nervous system fatigue. Similar to Training Load, HRV does not take into account any fitness metrics, but rather is simply a direct measurement of your heart rate variability during sleep.
Monitoring Overnight HRV allows runners to assess their neuromuscular fatigue (brain's efficiency in sending signals to working muscles) over time. While we break down the detailed HRV results in our blog, here are the four categories of your Overnight HRV:
- Elevated: HRV is elevated above your normal range. This typically indicates you are more relaxed, but please pay attention to other physiological factors.
- Normal: HRV is within your normal range. Your body is in good condition, proceed as planned.
- Reduced: HRV is slightly lower than normal. This typically indicates your body is under stress, consider additional rest.
- Low: HRV is significantly lower than normal range. Your body is in a very stressed condition, and taking additional rest is recommended.
Why does this metric matter? While HRV does not take into account any fitness metrics, it is influenced by various life stressors (sickness, lack of sleep, anxiety, etc.). Monitoring HRV can help you make informed decisions about your training schedule on the day to optimize performance and minimize injury risk.
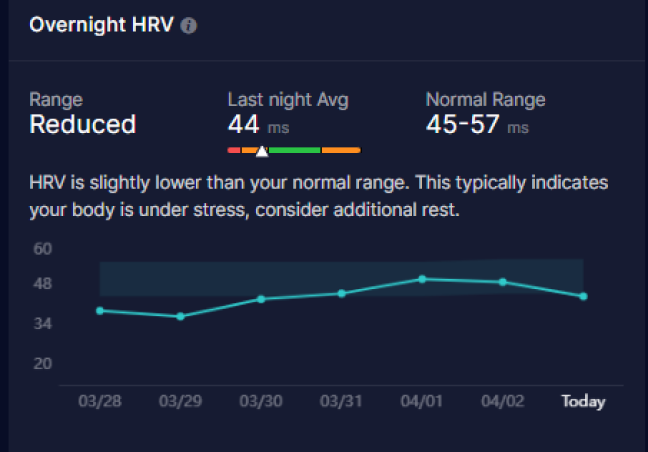
Overview of Overnight HRV from EvoLab.
Resting Heart Rate
Resting HR is very similar to HRV as it is calculated the same way. However, it can provide you with a slightly different story. While HRV is closely related to your neuromuscular fatigue, resting HR is closely related to your physiological fatigue. In other words, resting HR tells you if your engine is overheating or not.
While we do not provide any categories regarding resting HR, you can monitor this metric over time by looking for upward or downward trends that could indicate multiple different scenarios listed below:
- Decreasing: This is a good sign that your aerobic engine is getting better. However, this is a long-term process and you should not expect to see your resting HR decrease rapidly.
- Increasing: A sudden increase in resting HR can mean multiple things, but often times they are negative. Overtraining, sickness, or traveling, are all situations that can increase your resting HR temporarily.
Why does this metric matter? Similar to HRV, resting HR can give you small hints about what your body is going through on a given day. While we would not advise to take actions only based on this metric, it is relevant to monitor in combination with other recovery metrics to potentially identify any sign of "overheating" from your body.
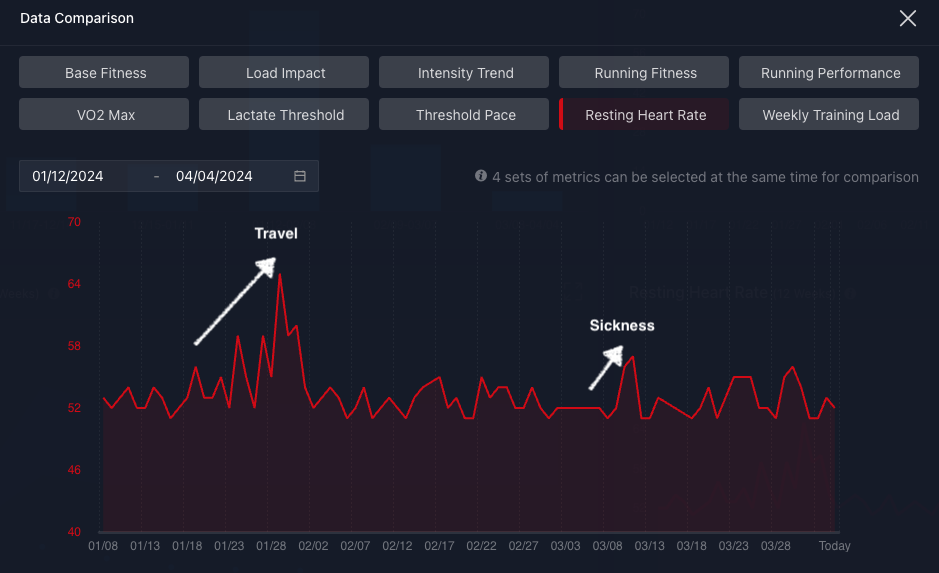
Resting HR graph as seen from COROS Training Hub.
COROS Recovery Metrics In A Glimpse
To help better understand all of these metrics and how they interact with each other, we took the information from above and simplified it into a chart.
While each metric tells a slightly different story regarding your recovery, it is important to keep an eye on more than one to get a clearer picture of what's going on.
| Metrics | Focus | Influenced By | Update Frequency |
| Weekly Training Load | Fatigue from training | Duration (time) & Intensity (HR) | Weekly |
| Training Status | Fatigue from training + fitness level | Training Load, Base Fitness, Load Impact | Daily |
| Recovery | Fatigue from training + fitness level + past week of training | Training Load, Base Fitness, Remaining energy | Hourly |
| Overnight HRV | Nervous system | Heart Rate Variability during sleep | Nightly |
| Resting HR | Physiological system | Lowest heart rate upon awakening | Nightly |
Ready to apply these recovery metrics to your training? Check out our blog on Athlete Recovery for a detailed guide on how to incorporate recovery into your training, and which recovery strategies to use.